Bitcoin (BTC) is currently hovering just below $100,000, indicating that bullish traders are not rushing to exit their positions as they expect the uptrend to continue. Raoul Pal, founder and CEO of Global Macro Investor, posted a chart on the X platform, predicting that Bitcoin could top $110,000 in January.
Many analysts remain bullish on next year. Tom Lee, co-founder and head of research at Fundstrat Global Advisors, believes that Bitcoin could surge to $250,000 by 2025.
However, it is not just Bitcoin that is attracting attention. Traders appear to be shifting their attention to altcoins. Popular analyst Mikybull Crypto shared on X that Bitcoin (BTC.D) dominance has broken below a two-year support line, signaling that the crypto market is entering an “altcoin season.”
Can Bitcoin break above $100,000 and spark another strong rally for altcoins? Let’s analyze 5 cryptocurrencies with strong chart structures.
BTC Technical Analysis
Bitcoin is facing resistance near the psychologically important $100,000 level. However, the positive sign is that the price remains above the rising trendline.
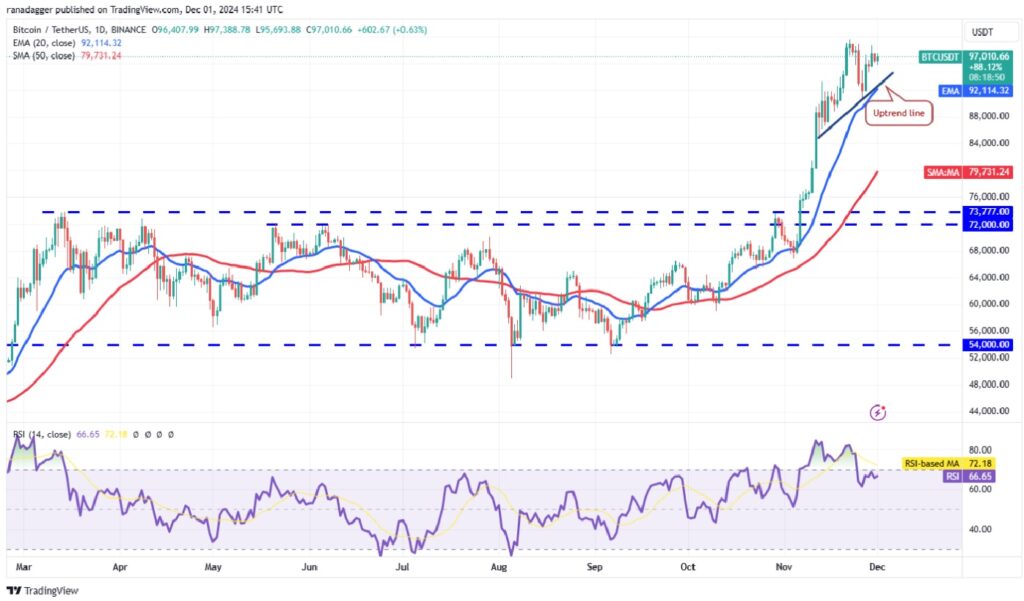
The 20-day exponential moving average (EMA) at $92,114 is sloping up and the relative strength index (RSI) is in the positive territory, suggesting that the bulls are in control. This increases the possibility of a breakout above $100,000. If that happens, the BTC/USDT pair could rise to $113,331, and then $125,000.
Conversely, bearish traders would need to pull the price below the 20-day EMA to weaken the bullish momentum. In that case, the pair could drop to $85,000, a level that is expected to attract buyers.
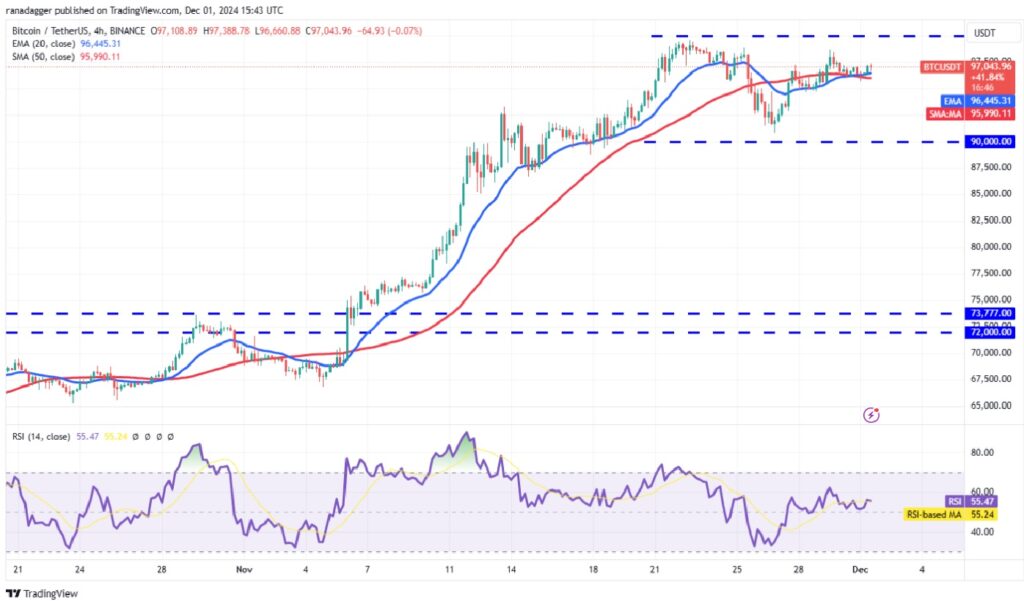
On the 4-hour chart, the moving averages have flattened out and the RSI is just above the mid-range, suggesting that supply and demand are in balance. The price could consolidate in the $90,000–$100,000 range for some time.
A breakout and close above $100,000 would indicate that the bullish traders have absorbed all the selling pressure, opening the door to a rally to $113,331. Conversely, a drop below $90,000 could prompt short-term traders to book profits, dragging the price to $85,000.
SHIB Technical Analysis
Shiba Inu (SHIB) surged above the $0.000030 resistance on December 1, completing a bullish inverted head and shoulders pattern.
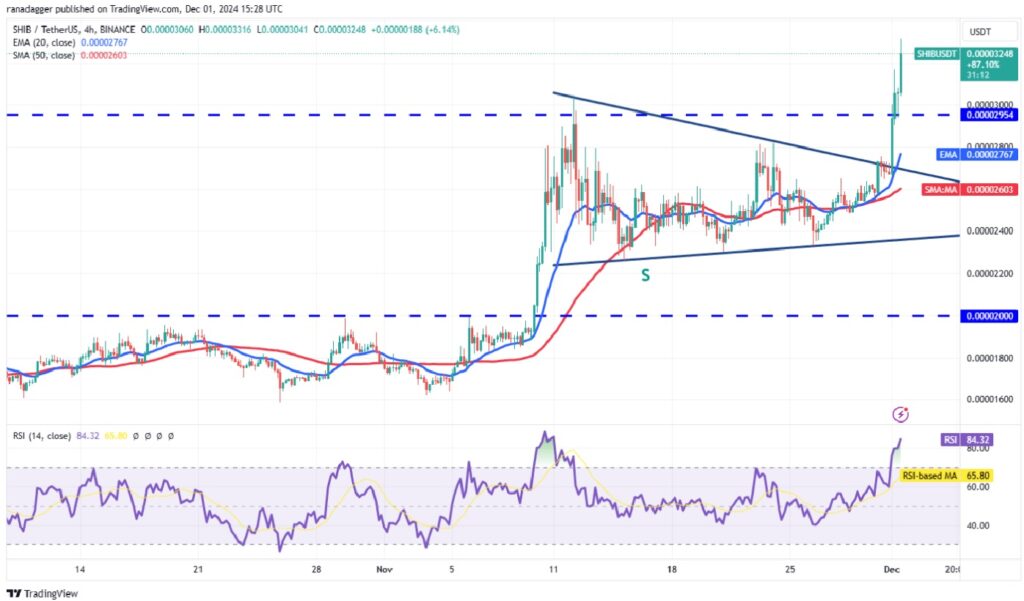
If buyers hold above $0.000030, the SHIB/USDT pair could rise to $0.000039. This level could face stiff resistance, but if cleared, the pair could continue to rise towards the pattern target at $0.000047.
Conversely, if the price fails to sustain above $0.000030, it would suggest that the rally was a bull trap. The price could then drop to the 20-day EMA ($0.000025), which is expected to attract buyers.
The pair closed above the $0.000030 resistance on the 4-hour chart, but the bears are not giving up easily. They will try to pull the price back below the breakout level. If they can do so, the pair could collapse to the 20-EMA.
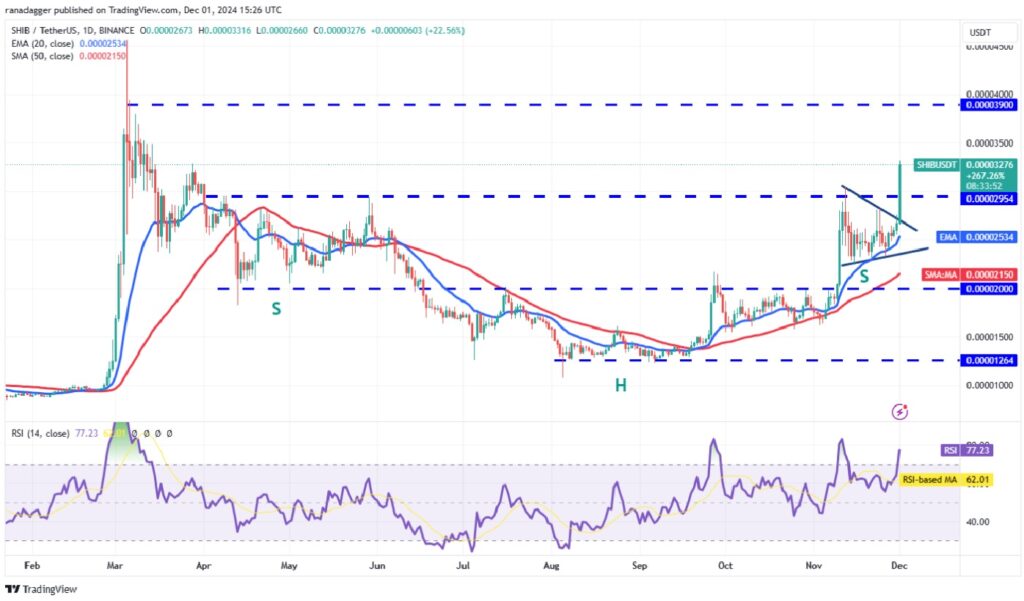
On the 4-hour chart, the price closed above the $0.000030 resistance level, but the bearish traders are not giving up easily. If the price breaks below this level, the SHIB/USDT pair could decline to the 20-EMA.
On the contrary, if the price stays above $0.000030, it would suggest that this level will become new support, with the next target at $0.000035 and then $0.000039.
FIL Technical Analysis
Filecoin (FIL) broke above and closed above the $6.77 resistance level on November 30, completing a bullish rounding bottom pattern.
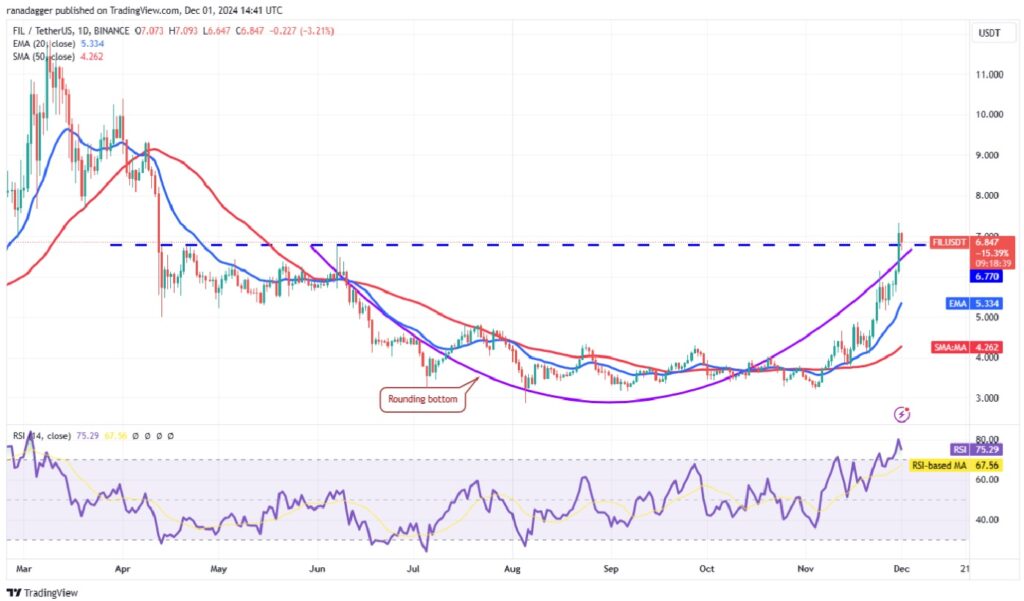
bearish traders will attempt to pull the price below $6.77 to trap overconfident buyers. If successful, the FIL/USDT pair could decline to the 20-day EMA ($5.33). Bulls need to defend the 20-day EMA strongly to maintain positive sentiment.
A bounce from the current level and clears $7.33 will confirm that $6.77 has turned into support. The pair could then rally to $9.34.
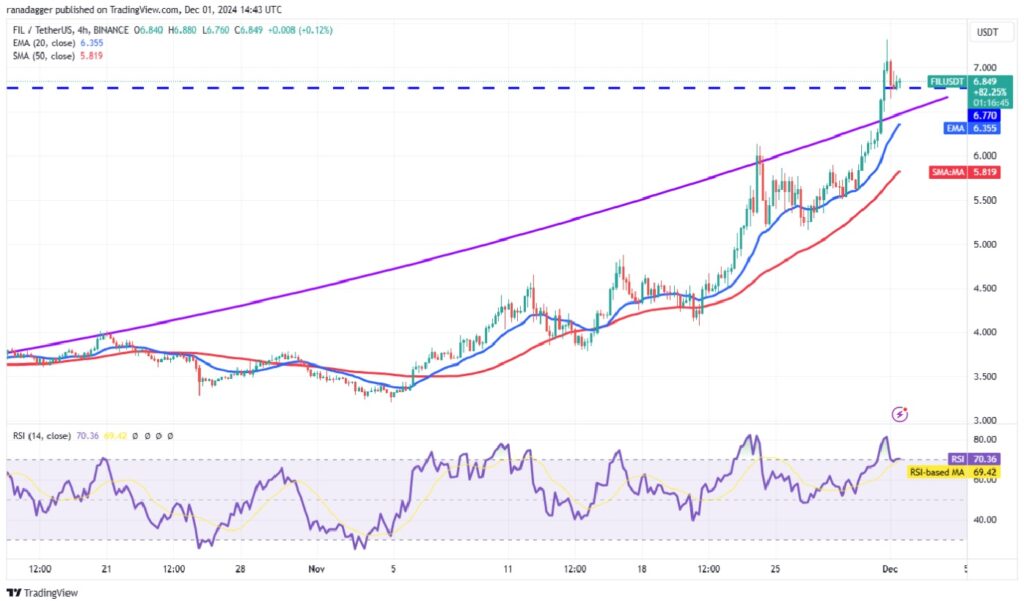
bulls and bears are facing an uphill battle at the breakout level of $6.77. The upsloping moving averages and the RSI in the overbought zone signal an advantage for the bulls. A bounce and a break above $7.33 will indicate a continuation of the uptrend.
Conversely, a break below $6.77 could send the pair down to the 20 EMA and then the 50 SMA. Sellers will have to sustain the price below the moving averages to regain the upper hand.
MNT Technical Analysis
Bullish traders are trying to push Mantle (MNT) above the $0.94 resistance.
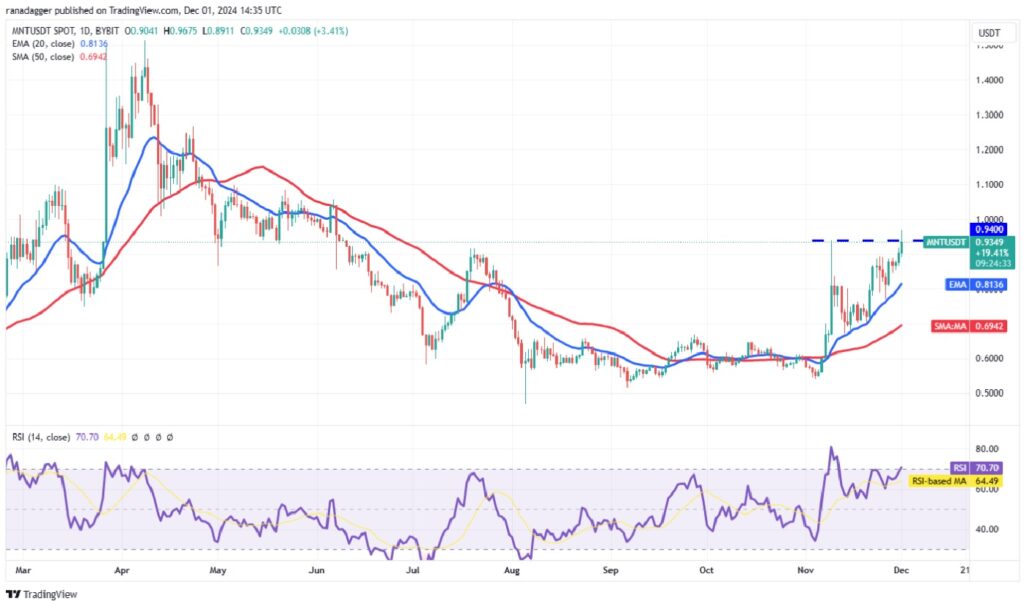
If the bulls succeed, the MNT/USDT pair could rise to $1.10, where bears are expected to continue to establish a strong defense.
If the price fails to sustain above $0.94, it will indicate that bears are active at higher levels. The pair could then decline to the 20-day EMA ($0.81), a key level that bulls need to defend. If the price bounces strongly from the 20-day EMA, the possibility of a breakout above $0.94 increases.
Bears will regain the initiative if they pull the price below the 20-day EMA. The pair could then decline further to the 50-day SMA ($0.69).
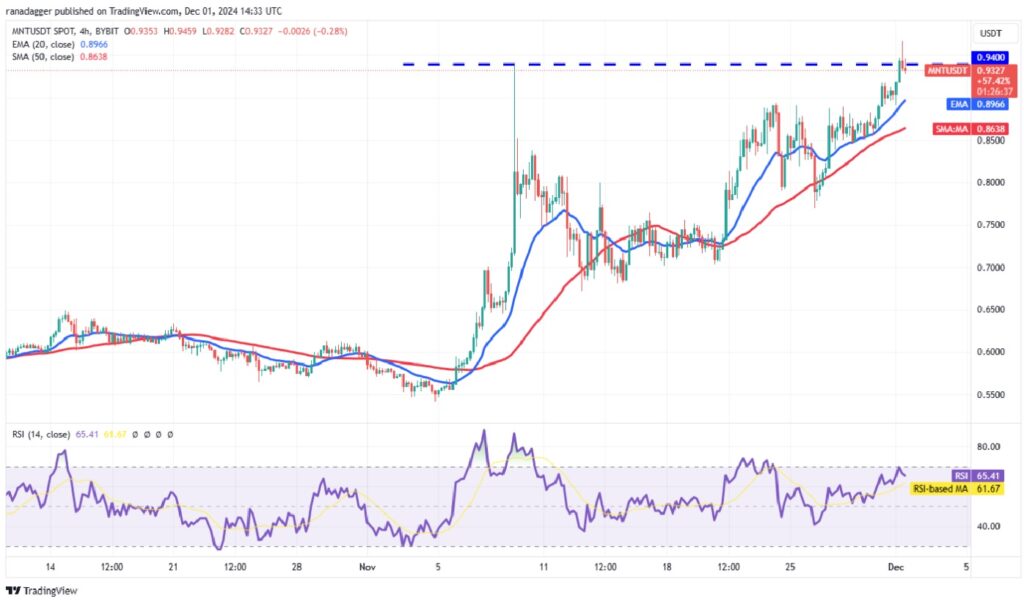
On the 4-hour chart, both moving averages are sloping up and the RSI is near the overbought zone, suggesting that the bulls are in control. The bulls pushed the price above $0.94 but failed to sustain at higher levels.
The 20 EMA is the first support to watch if the price declines. If the price turns around from the 20 EMA, it will indicate that the market sentiment remains positive. The bulls will then attempt to push the price above $0.95.
AAVE Technical Analysis
Aave (AAVE) price broke and closed above the $200 resistance on November 27, marking the continuation of the uptrend.
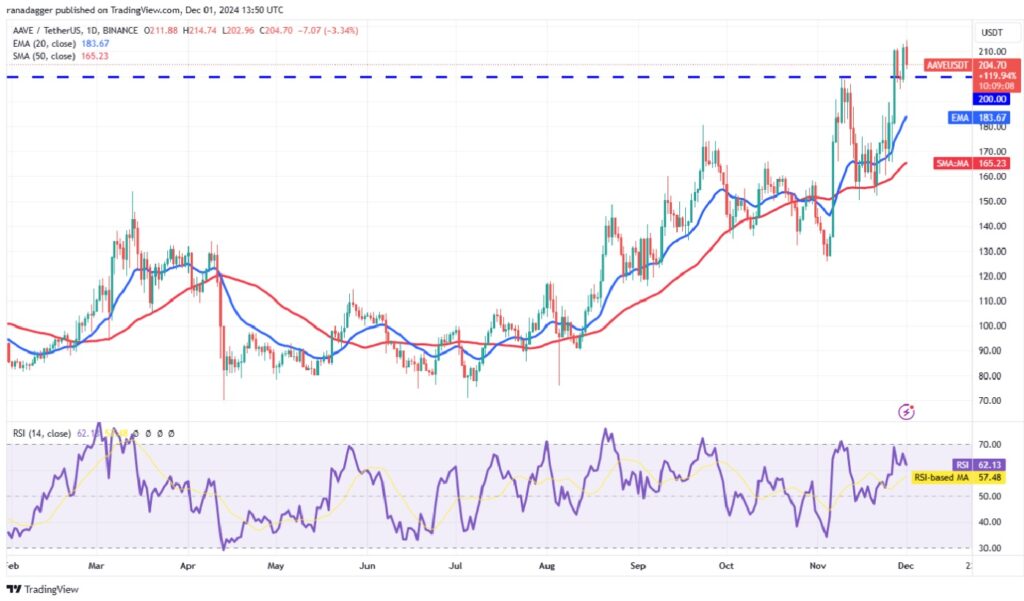
bearish traders pulled the price back below $200 on November 29 but failed to sustain it at lower levels. The AAVE/USDT pair rebounded from $200 on November 30, indicating that the bulls are trying to turn this level into support. The bulls need to sustain the price above $215 to pave the way for a rally towards $260.
This bullish view will be invalidated in the short term if the price declines and breaks below $194. The pair could then drop to the 20-day EMA ($183).
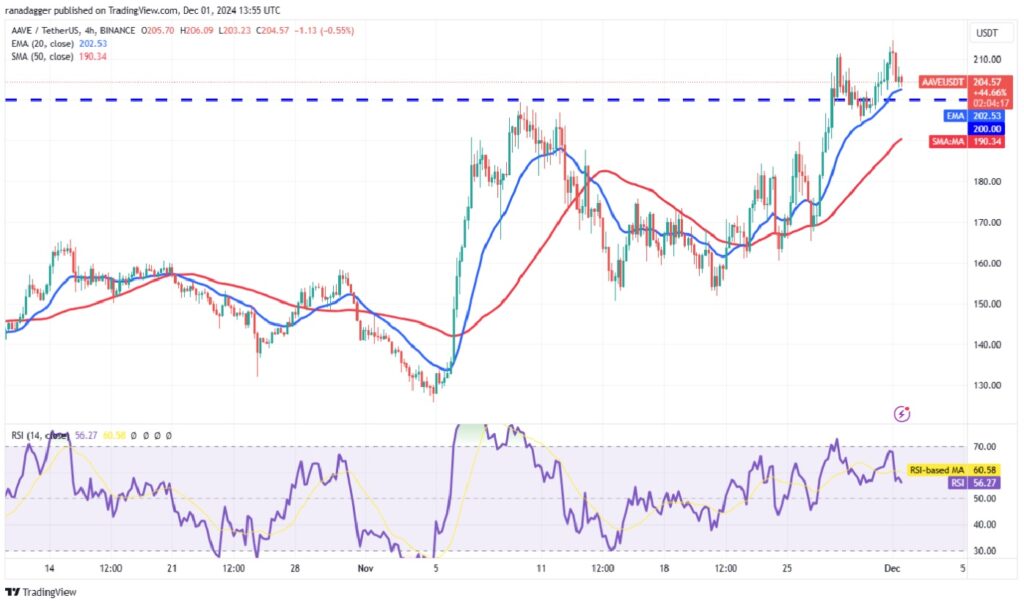
bearish traders are trying to pull the price towards the 20-day EMA, which is a key support to watch in the short term. A sharp bounce from the 20-day EMA would indicate buying on dips. This would increase the prospect of a continuation of the uptrend.
Conversely, if the price breaks below the 20-day EMA, it would indicate that the bulls are losing control. The pair could then drop to the 50-day SMA. Bulls are expected to mount a strong defense at the 50-day SMA, as a break of this level could tip the balance in favor of the bears.

