If you are trading cryptocurrencies, it is important to know how to read cryptocurrency charts. Anyone who trades in the stock market needs to have basic chart reading skills. Whether it is the stock market or the cryptocurrency market, charts support the trading process. Charts mainly show 2 characteristics: price and volume. Price on the chart shows changes in the cost of cryptocurrency over time. Volume shows how many units have been traded.
There are 2 main charts used for trading cryptocurrencies: line charts and candlestick charts. This article will guide you on how to distinguish and understand them.
Line chart
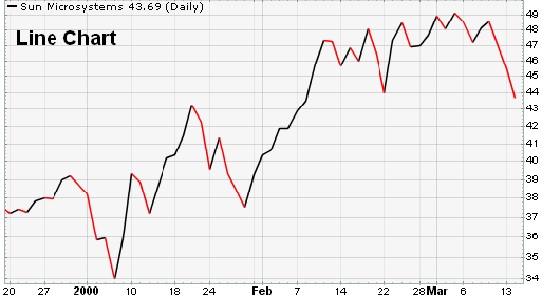
This is the simplest chart and shows price movement in the form of a straight line. A line moving up shows an upward trend in price. A line sloping down shows a downward price. Line charts can be drawn for any time period. This is a chart that investors use to track the movement of the cryptocurrency they have purchased.
Day traders (buying and selling coins on the same day) will use a chart that shows the price change over the course of a day. Line charts can even show changes over hours or minutes. Day traders use real-time charts that show the price movement immediately. Since prices can fluctuate within seconds, day traders need this type of chart.
The line chart below shows the movement of a cryptocurrency over a period of 1 year. The price changes are shown by month of the year on this chart. Volume is also shown as a bar chart. For each price movement, the corresponding volume is shown.

From this chart, we can see that the highest price was at the end of June when it almost touched $13,000. The lowest price was in mid-March when it dropped below $3,000 and almost touched $2,000.
Looking at the chart, the price suddenly increased to $4,000 in early May. From there, it continued to go up. If you had bought at that time, you could have made a good profit. How do you know the price will go up? The answer lies in the trading volume. According to the volume bar chart, you can see that there are more than 30,000 transactions. The volume shows that more people are buying. It is a clear sign of an uptrend. If you know how to read this trend, you could have made a lot of money.
When the volume bar is green, it shows that there are more buyers. When it is red, it shows a selling trend. Reading price and volume from a line chart is just one way to read a cryptocurrency chart. There are many other tools that can be used as well. For example, moving averages are a tool used in technical analysis to read price changes in a more systematic way. Technical analysis provides a variety of similar tools. Mastering technical analysis can help you read charts well and understand crypto trends.
Candlestick Chart
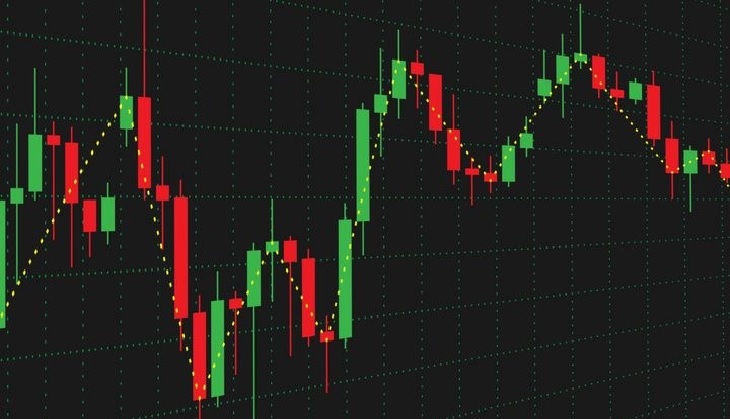
This is a favorite chart of experienced traders to help them understand market trends and predict how the market will move. This chart uses symbols called candles, which show the high, low, open, and close prices. A candle represents a period of time, which can be 1 minute, 1 hour, 1 day, or even 1 month – depending on the type of chart used.
If the candle is green, it shows that the closing price is higher than the opening price. This means that the trend is in favor of buyers. Conversely, a red candle shows that the closing price is lower than the opening price, which shows that the trend is in favor of sellers. These candles will help traders understand the market better. It is a favorite tool of traders when making trading decisions.

Candlesticks form many patterns that can indicate a change in trend. A smart trader or investor will spot this trend and make a quick decision that can help make a profit. For example, the candlestick pattern is called a hammer.
The hammer shows that the price dropped low, but then again rose well above the low and closed above the open. This indicates that buyers overcame sellers and pushed the price higher. If you spot such a candle on the chart and it is accompanied by good volume, it is a sure sign of a strong uptrend or increase. Thus, the price will go up. A candlestick chart not only tells you about the price and volume, it even tells you about the psychology of traders. It gives you an insight into the thought process of other traders. It helps you get a feel for the general sentiment of the market. It is important to note that this sign cannot be used to make a definite prediction. An experienced trader will look for various signs on the chart to confirm what is happening.
All this shows that you can read cryptocurrency charts by learning technical analysis. This method equips you with the tools to read charts and understand the message that the chart is trying to convey. Mastering technical analysis can help you become a good trader, able to predict market trends and make appropriate decisions.

