November has been a standout month for many assets hitting new highs, and altcoins in the Real World Assets (RWA) tokenization space are no exception. Many RWAs have surged to multi-year highs, and some appear poised to extend their gains.
Prominent tokens such as Avalanche (AVAX), Chainlink (LINK), Artrade (ATR), Ondo (ONDO), and XDC Network (XDC) have seen significant gains in recent weeks, with these altcoins making waves in the crypto market recently.
Avalanche (AVAX)
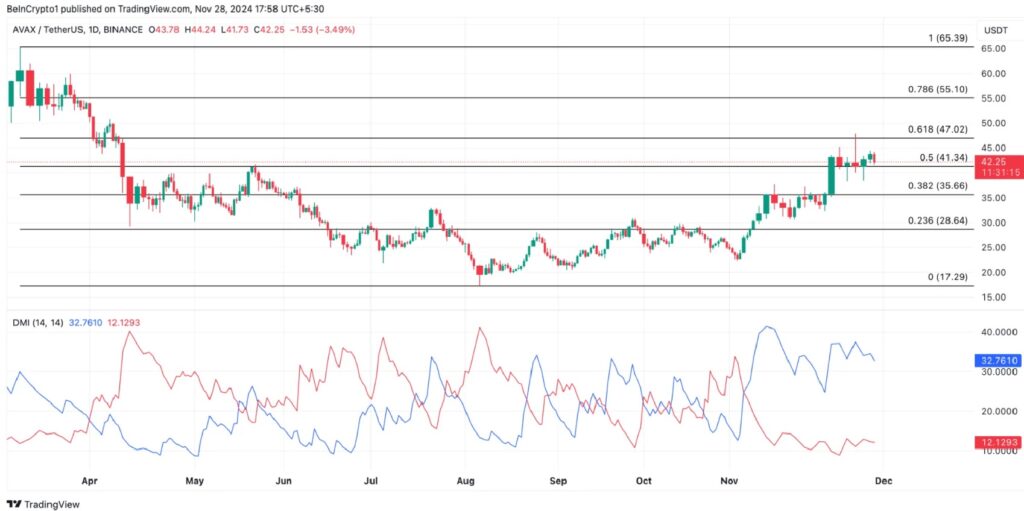
AVAX, the native token of the Avalanche layer 1 blockchain, has seen a 20% price increase over the past week, making it one of the notable RWA altcoins in December. As of press time, AVAX is trading at $42.25.
AVAX’s Directional Movement Index (DMI) on the daily chart shows that the bullish momentum is strong. At the time of writing, the DI+ (blue) is above the DI- (red), reflecting an upward market trend.
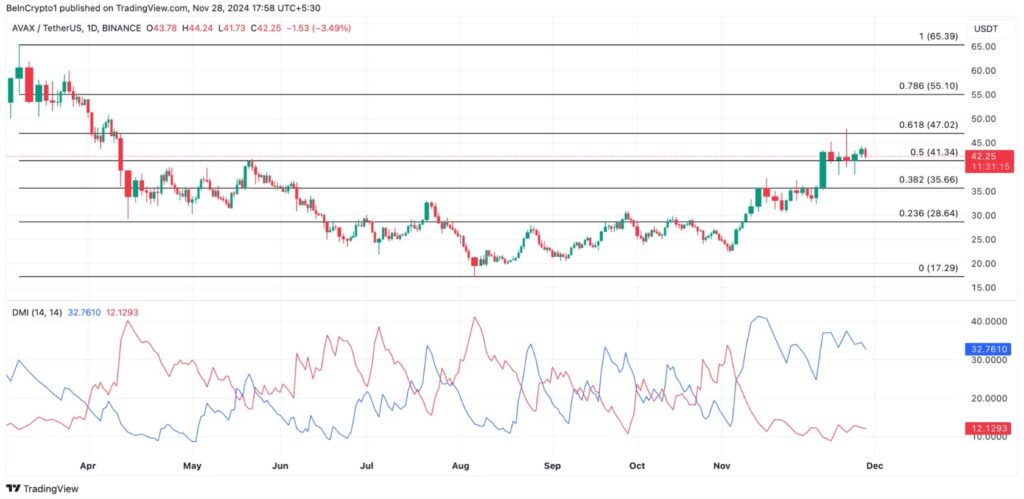
The DMI indicator measures the strength and direction of a trend. When the DI+ line is above and away from the DI- line, it signals that the market is in an uptrend, with upward price pressure stronger than downward pressure. This is often a signal for traders to consider buying.
If this trend continues, AVAX could rise to $47.02. If this resistance level is broken, the price could reach $55.10. Conversely, if selling pressure increases, AVAX could fall to $35.66.
Chainlink (LINK)
Chainlink, the leading oracle network, backed by the LINK token, has recorded a 24% price increase in the past 7 days, making it a notable RWA token in December. Currently, LINK is trading at $17.98, its highest price since June.
At the moment, LINK is trading above the green line of the Super Trend indicator, confirming the uptrend. This indicator measures the direction and strength of a trend. When the Super Trend line appears below the price, as in the case of LINK, it indicates an uptrend, indicating that the bullish momentum is very likely to continue.
If this trend continues, LINK price will rise to $19.38. If it breaks above this level, LINK could reach a yearly high of $22.87. Conversely, if the market sentiment turns negative, the LINK price could drop to $17.22.
Artrade (ATR)
Artrade is an online marketplace for physical artworks. The platform’s ATR token has seen a 103% increase in price over the past 7 days.
On the daily chart, ATR’s 50-day simple moving average (SMA) crossed above its 200-day SMA on November 23, forming a “golden cross” – a strong bullish signal that signals an upward price trend. Following the crossover, ATR’s price surged 38%, reaching a 6-month high of $0.032 at the time of writing.
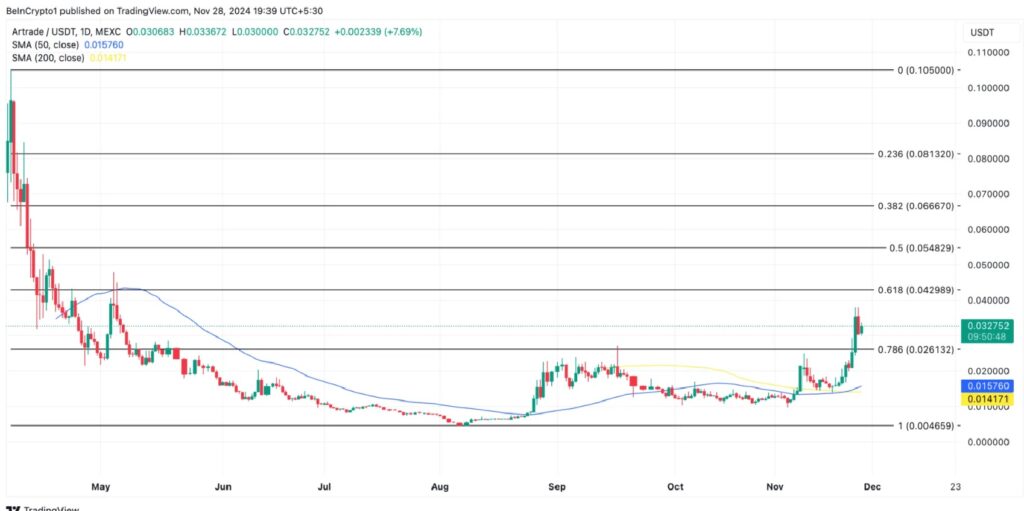
When the yellow and blue lines intersect (see image above), the recent price momentum (50-day) is stronger than the long-term trend (200-day), confirming the transition from a downtrend to an uptrend and suggesting a potential further increase in price.
If this trend is maintained, the ATR price could rise to $0.042. Conversely, if buying activity declines, the ATR price could fall to $0.026.
IOTA (IOTA)
IOTA, the native token of the open-source and decentralized distributed ledger platform IOTA, is one of the RWA altcoins to watch in December. IOTA is currently trading at $0.22, after a slight decline from a 7-month high of $0.25 reached during Monday’s trading session.
Despite the price drop, the uptrend in IOTA remains strong. The Parabolic Stop and Reverse (SAR) indicator confirms this. Currently, the points of this indicator are below the price of IOTA.
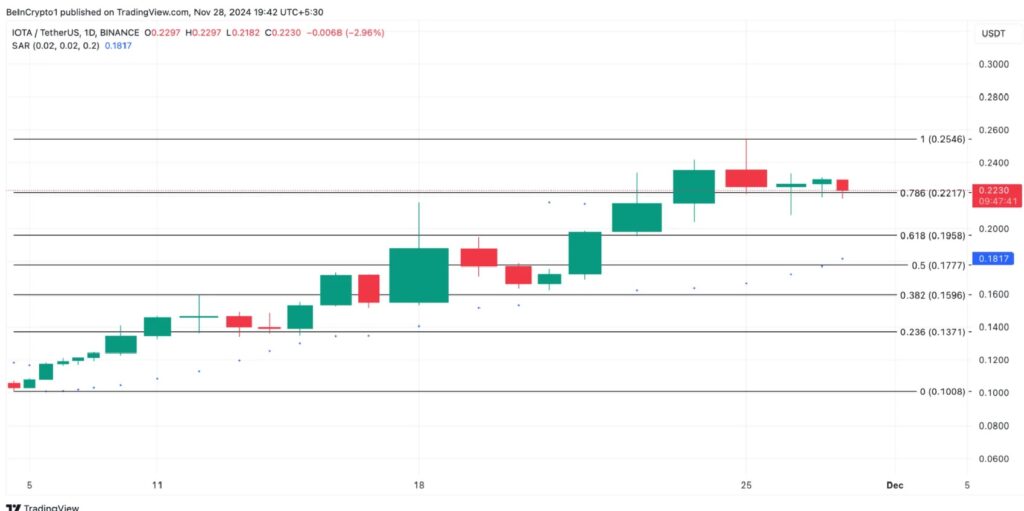
SAR helps identify potential price trends by placing points above or below the price. When the points are below the price, it signals an uptrend, indicating that the bullish momentum may continue.
If this trend continues, IOTA could rise to $0.25 and attempt to break above it. Conversely, if the buying pressure decreases, the price of IOTA could fall to $0.19.
XDC Network (XDC)
XDC Network, backed by the XDC token, is a blockchain platform for businesses, focusing on tokenizing real-world assets and financial instruments. XDC is one of the notable RWA altcoins in December, with a 32% price increase over the past week.
The bullish MACD indicator indicates a bullish trend for this token. At the time of writing, the MACD line (green) is above the signal line (orange).
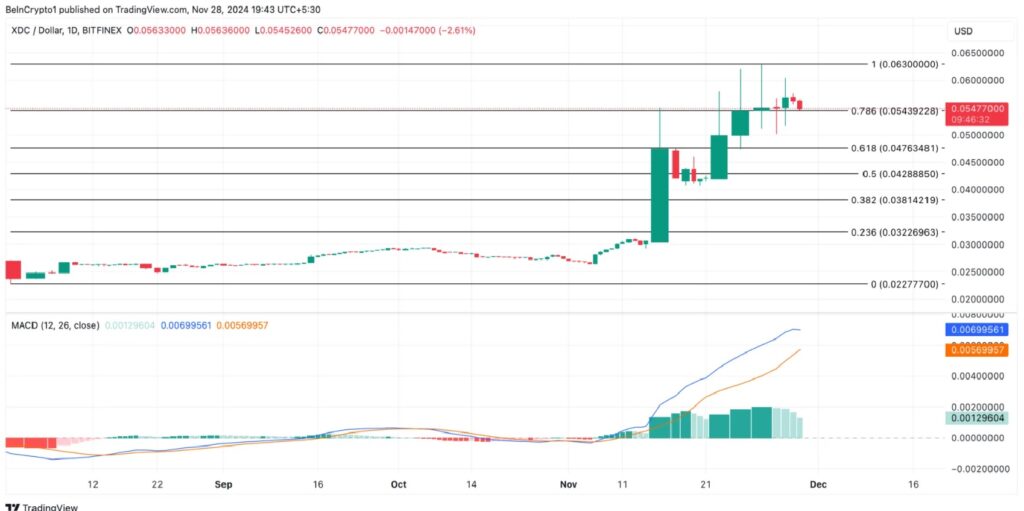
The MACD indicator helps identify changes in the strength and direction of a trend. When the MACD line is above the signal line, this indicates bullish momentum, suggesting the potential for further price increases as the short-term trend is stronger than the long-term trend.
If this trend continues, the XDC price will rise to $0.063. Conversely, if selling pressure increases, the XDC price could fall to $0.047, breaking this bullish outlook.
