Bollinger Band is a technical indicator formed by combining the MA (Moving Average) and the standard deviation to find out when to buy and sell. In some cases, the Bollinger Band indicator is used as a trend indicator to show whether the market is trending strongly or weakly. The sideways market (no trend) will cause the Bollinger Band to narrow. The market is active (strong trend) will cause the band to widen. Or Bollinger Bands also signal potential tops and bottoms.
How Bollinger Bands Work
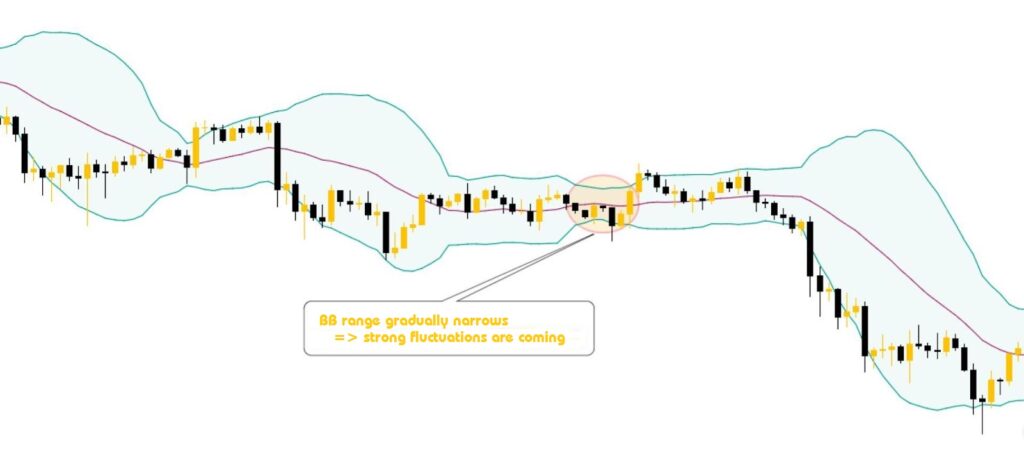
When the Bollinger Bands gradually narrow during a period of low market volatility (sideways). This predicts a strong trend is about to happen. That trend can be up or down. Since BB is an indicator that measures price volatility, it will not help traders predict the upcoming up or down trend.
When the Bollinger Bands expand abnormally, it indicates strong price volatility. And in some cases, it is also a signal that the current trend (up or down) may be about to end.
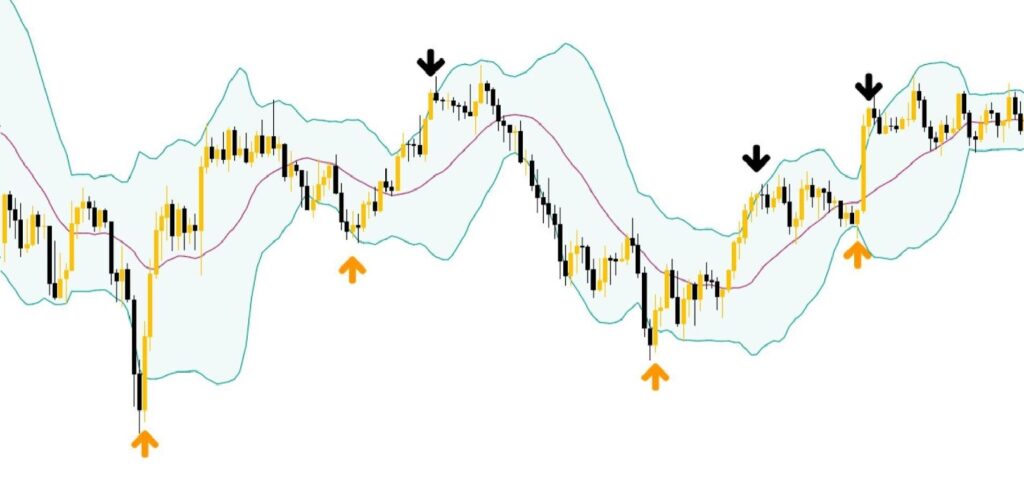
Prices tend to move within the BB band, when touching the upper or lower Band, the price will tend to reverse. Therefore, some traders will use these fluctuations to identify potential entry and target zones.
When the market is highly volatile, prices may exceed or hug the upper or lower Band for a long time. Therefore, when the market is in a strong trend, you should limit your ability to bet on the trend and look for some reversal divergence signals from momentum indicators.
When the price breaks the upper or lower Band, it can lead to a strong trend. Besides, if the price then returns within this band, the strong trend will be rejected.
Some characteristics of Bollinger Band (BB)
- Price will fluctuate between the upper and lower Bands
Price tends to fluctuate within the limits between the upper and lower Bands. Usually, the price will close within the upper range (Trading Range) and tends to return to the center line when touching 2 Bands.

This is considered a typical example of price fluctuation within 2 bands of Bollinger Bands. In the image above, we can see that in a strong downtrend, although many candlesticks break out of the 2 Bands, most of the candles have closing prices within the 2 bands.

- Bollinger bands narrowing will cause a price spike
The phenomenon of the BB band narrowing is called a bottleneck phenomenon, the possibility is very high that there will be a strong fluctuation, which can increase or decrease.
The basic sign to recognize the bottleneck phenomenon is that the 2 Bands gradually narrow and the price begins to move slowly to prepare for a pump/dump.
As I mentioned above, because the BB line is considered an indicator that determines the strong trend according to the weak (volatility), you need to combine it with some other indicators to determine whether to Buy or Sell.
How to use the Bollinger Band indicator
- Scalping trading according to the Bollinger Bands price channel
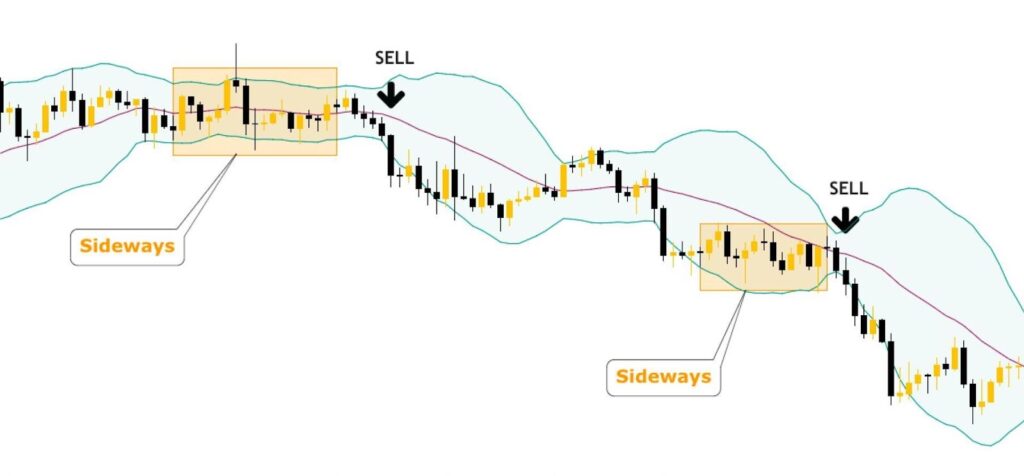
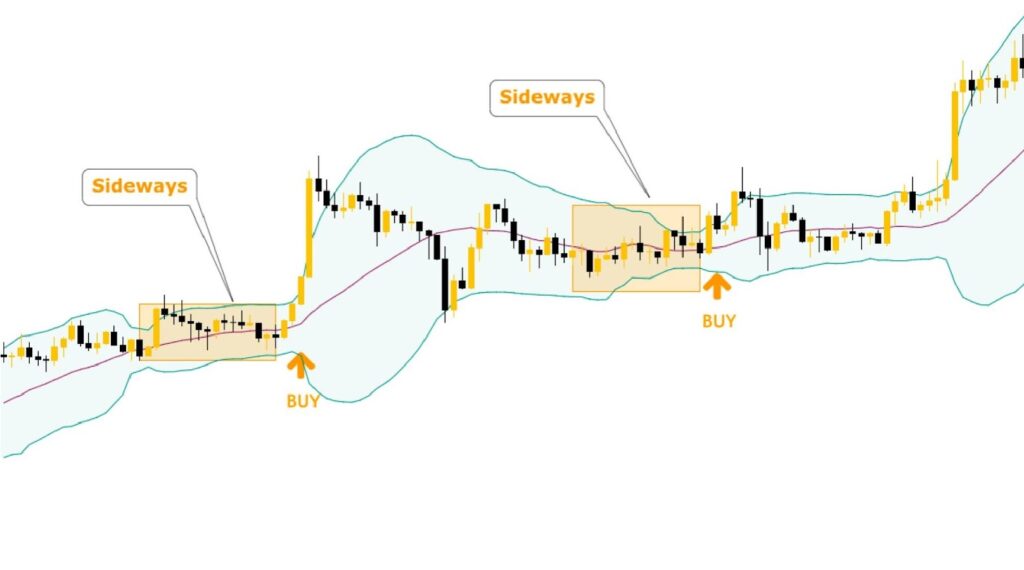
Trading principles: Only applied when the market is Sideways, the BB indicator is almost contracted, the middle axis is almost horizontal.
Buy when the price touches the lower band. Sell when the price touches the upper band. Because it is Scalping, this trading method is often used to trade margin with large leverage. You should consider the risks when trading with this method, limit holding an order for too long, you can close a Buy order when the price touches the upper band and close a Sell order when the price touches the lower band.
Absolutely do not apply this method when the market has a strong trend.
HHIIIINHH5
- Trading at the breakout point of the price channel after the sideways process
The narrowing of the Bollinger Bands shows that the market is about to explode in price and the price will break out of BB very quickly. If the candlestick starts to break out of the upper peak of the band, the price will usually continue to go up. Similarly, when the price breaks out of the lower peak, the price will usually continue to go down:
Price breaks out of the lower band => Sell

Price breaks out of the upper band => Buy

Combine the Bollinger Band with other candlestick patterns or indicators
One of the Bollinger Band strategies is to combine the Bollinger Band with reversal candlestick patterns. How to do it: Look at the Bollinger Band status in that area. Look at the resistance and support areas. Look for reversal patterns.
For momentum indicators, you can use any indicator such as MACD, RSI or Stoch. Because the nature of Bollinger Band is to measure price fluctuations, combining them will help you feel more secure about the probability of the signal being correct.
Conclusion
Prices tend to fluctuate between the upper and lower bands and converge to the middle band. When the two bands narrow, there is about to be a change, which can increase or decrease (also known as a bottleneck phenomenon).
We have just introduced to you the knowledge of how to use and trade with Bollinger Bands.

