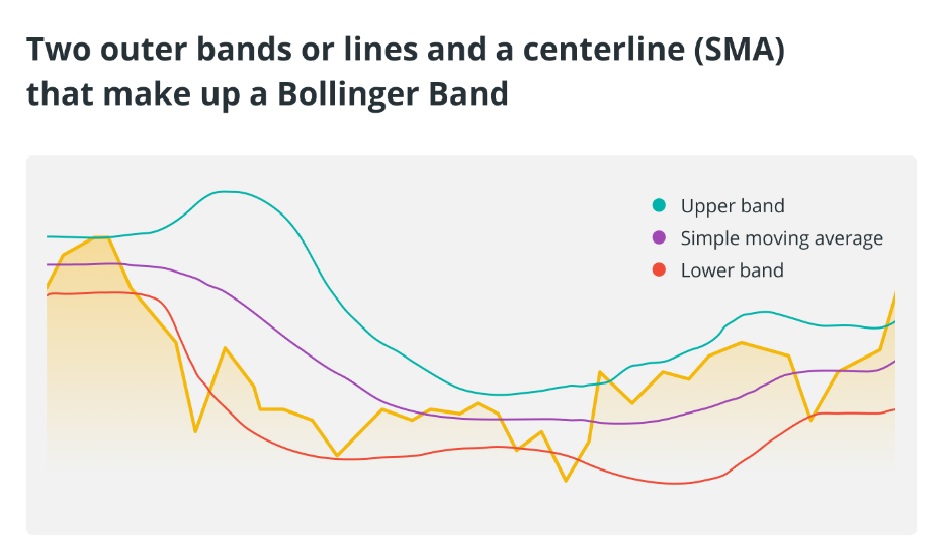
Bollinger Bands is an indicator that uses price movements to provide buying and selling opportunities in trading. It is made up of two outer bands and a center line (20-day SMA), which expand and contract in response to price changes. For a thorough market analysis, analysts often combine the indicator with other technical indicators.
Bollinger Bands (BB)
Bollinger Bands (BB) were created by John Bollinger in the 1980s. It is a useful technical analysis tool used in cryptocurrency trading and other financial markets to assess price volatility, identify potential reversal points, and make trading decisions. Bollinger Bands are built on three bands: the upper band, the middle band, and the lower band.
- Upper Band
The upper band is created by multiplying the middle band by the standard deviation of the price. Price volatility is quantified by the standard deviation. Traders often use a multiplier of 2 for the standard deviation (SD), but this can vary depending on market conditions and personal preferences.

- Middle Band (SMA)
The middle band usually represents the price of an asset over a certain period of time in the form of a simple moving average (SMA). It acts as the axis and depicts the average price of the cryptocurrency over the selected time frame.

- Lower Band
From the middle band, a multiple of the standard deviation is subtracted to determine the lower band.


Purpose of Bollinger Bands in Cryptocurrency Trading
In cryptocurrency trading, Bollinger Bands serve as an important technical analysis indicator for traders.
- Assessing Price Volatility
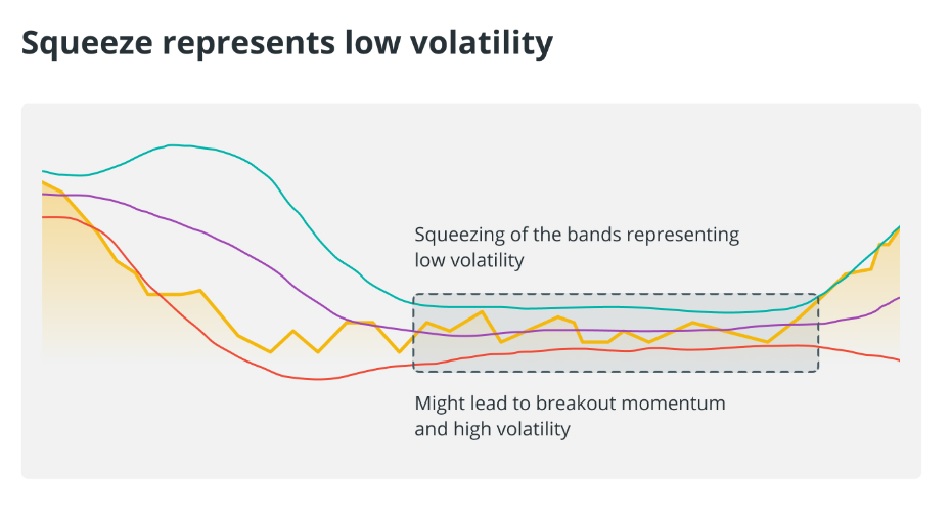
Traders can assess the level of price volatility in the cryptocurrency market using BB. When the bands expand, it indicates the possibility of trading with higher volatility. On the other hand, narrowing of the bands indicates less volatility, suggesting consolidation or trend reversal.
- Identifying Overbought and Oversold Conditions
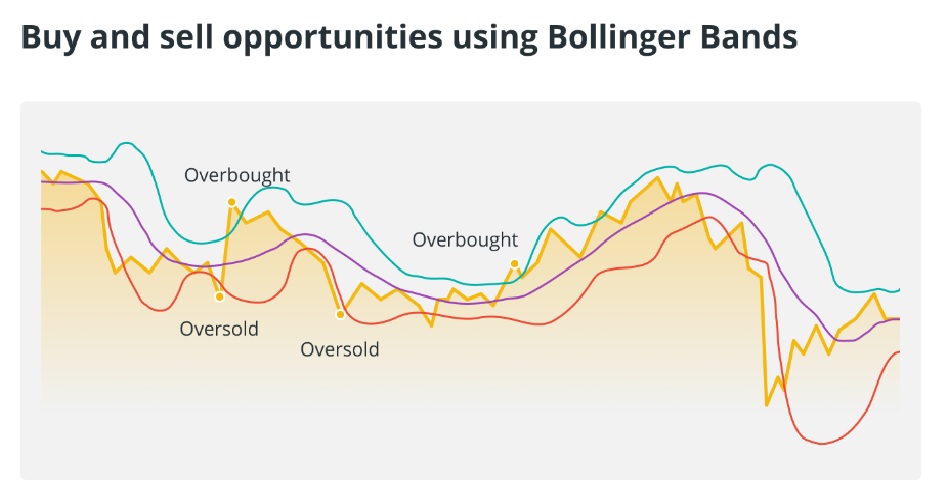
Bollinger Bands are used to help traders detect overbought and oversold conditions of an asset. Potential selling opportunities arise when the price reaches or crosses the upper band as it is a sign that the price is in an overbought condition. On the other hand, if the price reaches or falls below the lower band, it can be considered oversold, indicating a potential buying opportunity.

- Identifying the Trend
Traders can use the BB indicator to determine the direction of the current trend. An asset tends to be in an uptrend when it consistently moves along the upper band. On the other hand, if it frequently touches or remains near the lower band, it can be a sign of a downtrend.
- Reversal Signals
The BB indicator can be used to look for reversal signals of a trend. For example, a potential reversal from an overextended condition can be indicated when the price moves outside the band and then returns.
Cryptocurrency Trading Strategies with Bollinger Bands
Different cryptocurrency trading strategies with the BB indicator are used by traders.
- Bollinger Bands Squeeze Strategy for Cryptocurrency
The Bollinger Bands Squeeze approach is based on the idea that periods of low volatility in cryptocurrency prices (known as “squeezing”) are often followed by periods of high volatility (known as “expansion”).
Find the squeeze: Look for times when the Bollinger Bands are narrowing, a sign of decreasing volatility.
Prepare for a breakout: After a squeeze, traders expect a sharp price move. They don’t see the breakout direction but they are ready for it.
Entry: Traders enter a position after the price breaks out of the BB indicator (upper band breakout indicates an uptrend, lower band breakout indicates a downtrend), often using additional confirmation indicators, such as volume.
Stop loss and take profit: Place stop loss orders to limit potential losses if the breakout fails and set take profit levels according to the trading strategy (e.g. risk-reward ratio or at key horizontal resistance or support).

- Bollinger Bands Set Entry and Exit Points in Crypto Trading
When trading cryptocurrencies, whether for long-term investing or day trading, the BB indicator can be used to find suitable entry and exit points.
2.1. Entry Points
When the price reaches or breaks the lower band of the Bollinger Bands, it signals an oversold scenario, traders can look for a buy signal. Conversely, they view overbought conditions as a sell signal when the price reaches or breaks the upper band of the BB. However, more technical signals may need to be tested and confirmed.
2.2. Exit Points
Bollinger Bands can be used by traders to determine when to close a position. For example, this could be a sign to take profits if the price of a cryptocurrency approaches the upper band. Conversely, it may be time to close a short position if the price approaches the lower band.
- Combining BB with Other Technical Indicators
Bollinger Bands are often used by traders in conjunction with other indicators to complement their trading strategies.
- Bollinger Bands and RSI
Combining the BB indicator and the relative strength index (RSI) can help traders spot potential reversals. For example, a pullback may occur if the price is at the upper band of the Bollinger Bands and the RSI indicator shows overbought conditions.
- Volume Analysis
Bollinger Bands and volume analysis can be used to validate price action. An increase in volume during a breakout from the BB indicator can reinforce the validity of the signal.
- Bollinger Bands and Moving Averages
Moving averages are used by traders in conjunction with Bollinger Bands to add context to trend analysis. For example, Bollinger Bands and moving average crossover signals can help confirm trend changes.
Limitations of Bollinger Bands for Cryptocurrency Traders
Bollinger bands are a useful tool for cryptocurrency traders, but they also have some limitations. First, they can generate false signals during periods of very low or very high market volatility, which can lead to losses. Second, traders must use other indicators or analysis techniques to confirm the direction of the next move because the BB indicator does not provide directional information on its own.
The effectiveness of Bollinger Bands can also vary across different cryptocurrencies and time frames. Additionally, unexpected news or events in the market can lead to price gaps that are not reflected in the bands, which can catch traders off guard.
Risk Management Strategy When Using Bollinger Bands
Like any other technical indicator, Bollinger Bands should be used by crypto traders in conjunction with careful risk management and analysis. To reduce potential losses in case the price moves against their prediction, traders should set clear stop-loss orders.
Position size is also important. Traders should allocate a certain amount of cash to each trade to avoid overexposure. Furthermore, risk can be minimized by diversifying across different cryptocurrencies and limiting the percentage of capital that can be lost in a single trade.
Finally, Bollinger Bands should always be used in conjunction with other indicators to confirm the bigger market picture. To achieve long-term success with Bollinger Bands, traders must maintain discipline and follow a clear risk management strategy.

